Single-Event IPCW: Guided Example
Source:vignettes/single-event-guided-example.Rmd
single-event-guided-example.RmdThis vignette demonstrates inverse probability of censoring weighting (IPCW) for a single-event survival outcome. We use a simulated dataset that mimics a clinical trial of patients with chronic myeloid leukemia. The primary endpoint is progression-free survival (PFS). Participants are randomized to receive either chemotherapy or a tyrosine kinase inhibitor (TKI). Participants can be censored for the primary endpoint due to treatment intolerance or excessive toxicity, which is expected to occur equally for the two treatment groups. Treatment group is the factor of interest in this study. Dependent censoring arises because participants with higher absoluate neutrophil count (ANC) at baseline are less likely to go off study due to treatment intolerance, and therefore to be censored for PFS, and are also less likely to experience a progression or die.
Simulate data and compute IPCW weights
First, create a simulated dataset of n=500 patients
using the sim_data_se() function with all arguments set to
the defaults:
set.seed(67)
dat <-
  sim_data_se(
    n = 500,
    alpha = 0.05,
    x_prop = 0.5,
    a = 2,
    sigma = 500,
    beta = log(0.25),
    lambda = 0.01,
    phi = -5
    )
Key columns in the simulated data include:
-
t: observed time (event or censoring) -
delta: event indicator (1 = event, 0 = censored) -
x: treatment (0 = chemotherapy, 1 = TKI) -
W2: ancillary biomarker that drives informative censoring (ANC)
get_ipcw_wgt_se() converts the wide dataset to
counting-process (long) format and appends the unstabilized IPCW weight
column wgt.
dat_long <- get_ipcw_wgt_se(dat)IPCW Kaplan-Meier curves
First, to get an appropriate confidence interval for the Kaplan-Meier
plot, we need to account for the fact that the IPCW are estimated from
the data. We do this using bootstrapping and produce a Kaplan-Meier plot
with bootstrap-based pointwise confidence intervals. First, generate the
bootstrapped datasets with weights using the function
get_ipcw_boot_se(). Note that depending on the size of the
data and the number of bootstrap samples, the bootstrapping step can
take some time to run, so the below code is not executed here.
boot_dat <-
  get_ipcw_boot_se(
    data = dat,
    B = 500,
    time_var = "t",
    event_var = "delta",
    cens_cov = "W2",
    seed = 20240917)
Then, create the plot with the plot_ipcw_km_boot_ci_se()
function. This too can take some time due to the large size of the
boostrapped data and the calculation of the pointwise confidence
intervals, so the below code is not executed here.
plot_base <-
  plot_ipcw_km_boot_ci_se(
    boot_data = boot_dat,
    orig_data = dat_long,
    pre_times = seq(0, 2429, 1),
    covariate = "x",
    weight_var = "wgt",
    event_var = "delta")

plot_base +
  xlim(c(0, 1000)) +
  scale_color_manual(labels = c("Chemotherapy", "TKI"),
                       values = c("#0078bf", "#f7c612")) +
  scale_fill_manual(labels = c("Chemotherapy", "TKI"),
                                 values = c("#0078bf", "#f7c612")) +
  labs(
    color = "",
    fill = "",
    x = "Days from treatment start",
    y = "Progression-free survival probability"
  ) +
  theme(legend.position = "bottom")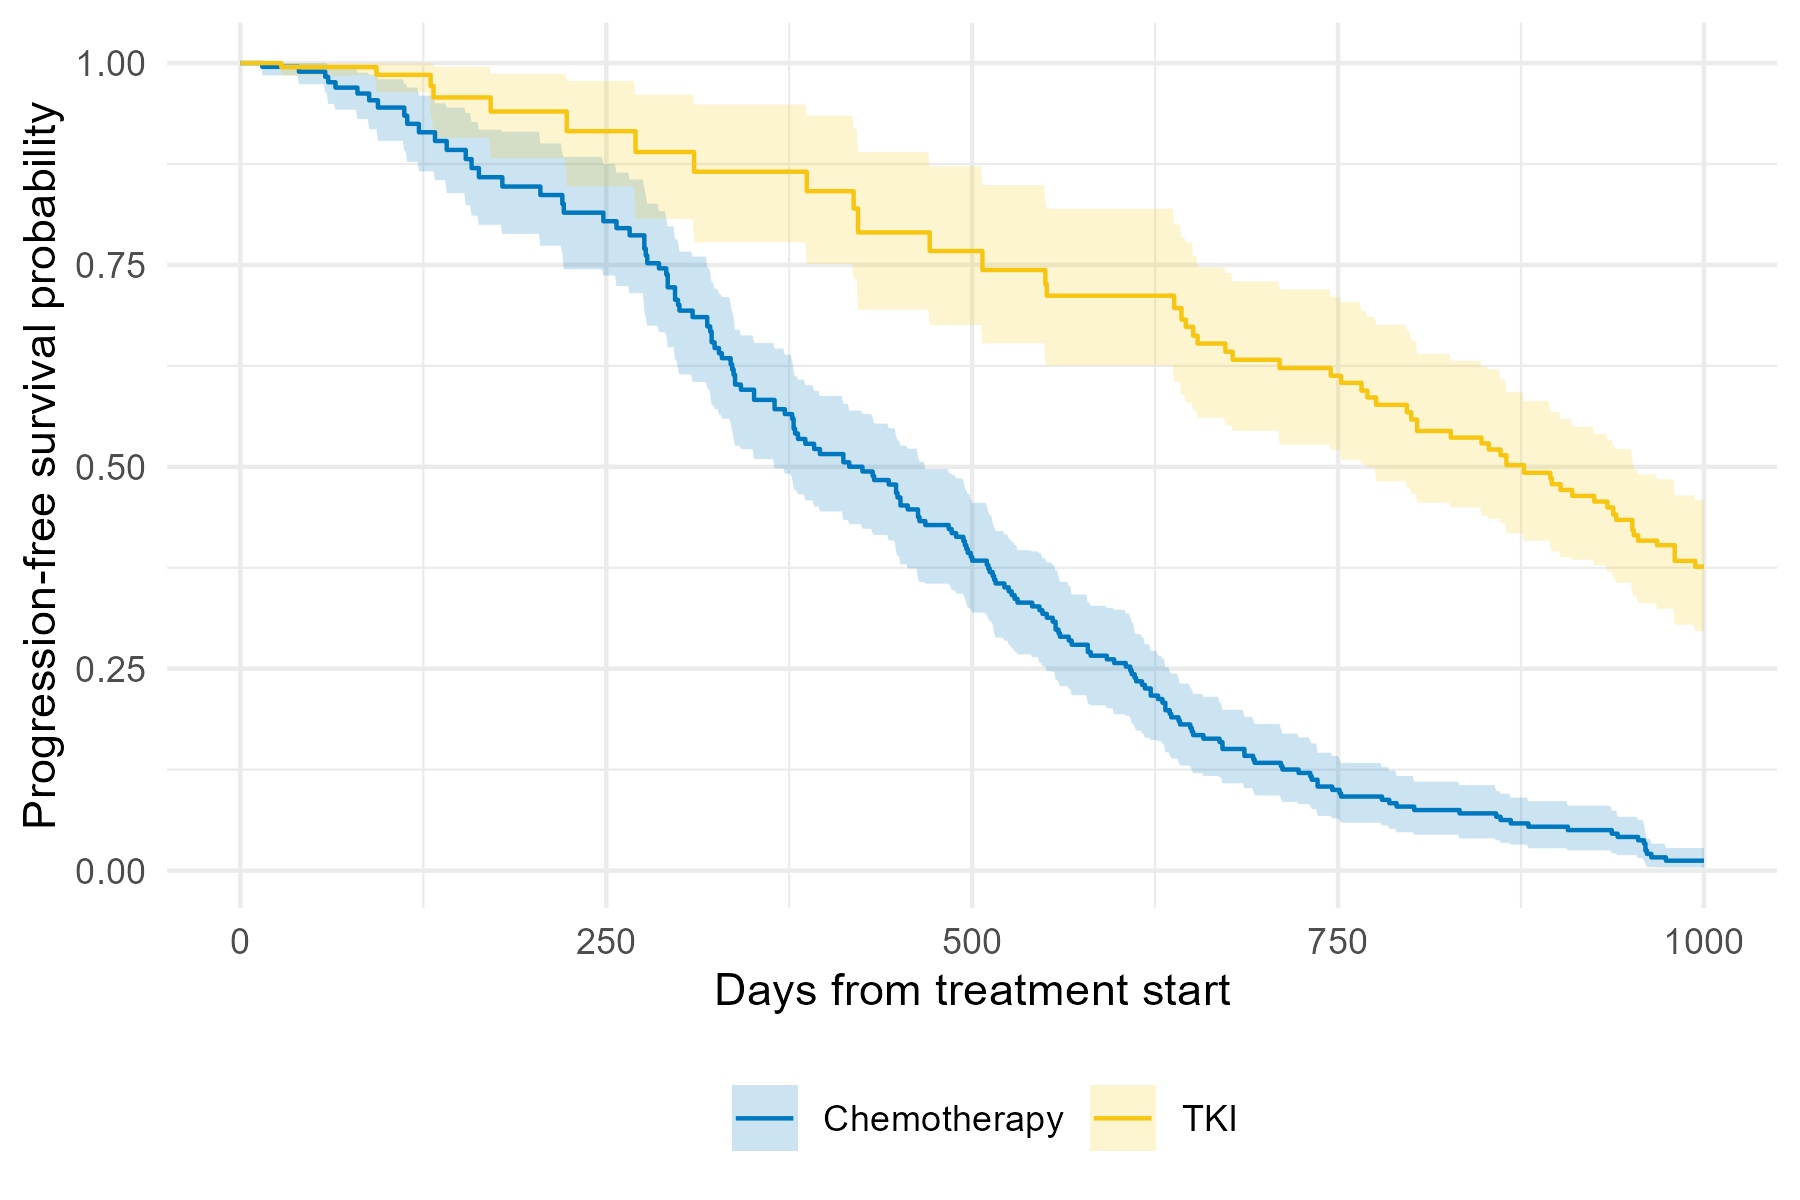
Patients in the TKI group have higher progression-free survival probability than those in the chemotherapy group, and that the bootstrap-based confidence intervals are not overlapping for most of the follow-up period.
IPCW Cox regression
Next, estimate the hazard ratio (HR) for the association between treatment group and PFS, accounting for the dependent censoring.
Use the convenience wrapper get_ipcw_cox_fit_se() to
obtain a tibble of results from the weighted Cox regression model.
cox_fit <- get_ipcw_cox_fit_se(dat_long, weight = "wgt")

cox_fit
#> # A tibble: 1 × 7
#>   term  log_hr log_hr_se log_hr_rob_se    hr hr_ci_low hr_ci_high
#>   <chr>  <dbl>     <dbl>         <dbl> <dbl>     <dbl>      <dbl>
#> 1 x      -1.41     0.109         0.183 0.243     0.170      0.348
Then fit the Cox model to each of the bootstrap datasets and extract
the log(HR) from each model fit. These will be used to construct
bootstrap percentile intervals. Because this process takes some time,
the resulting object cox_boot_lhr is included in this
package.
# Fit the Cox model to the B bootstrap samples
cox_boot_fit <-
  boot_dat |>
  map(~ get_ipcw_cox_fit_se(., covariate = "x", weight = "wgt"))

# Extract the B log HRs
cox_boot_lhr <-
  map_dbl(cox_boot_fit, "log_hr")
Use the function get_boot_pci_se() on a dataframe of the
log(HR)s to obtain the bootstrap-based 95% confidence interval.
# Calculate the bootstrap percentile interval
boot_pci <- get_boot_pci_se(data.frame(log_hr = cox_boot_lhr))
And combine the results into a table:
result_tab <- data.frame(
  Scale = c("log(HR)", "HR"),
  Estimate = round(c(cox_fit$log_hr, exp(cox_fit$log_hr)), 2),
  Lower_95pct_PI = round(c(boot_pci[[1]], exp(boot_pci[[1]])), 2),
  Upper_95pct_PI = round(c(boot_pci[[2]], exp(boot_pci[[2]])), 2)
)

result_tab |>
  gt() |>
  cols_label(
    Scale = "Scale",
    Estimate = "Estimate",
    Lower_95pct_PI = "Lower 95% PI",
    Upper_95pct_PI = "Upper 95% PI"
  ) |>
  # Add a footnote
  tab_footnote(
    footnote = "PI = percentile interval",
    locations = cells_column_labels(columns = c(Lower_95pct_PI, Upper_95pct_PI))
  ) |>
  tab_header(
    "IPCW Cox regression results for the association between treatment group and progression-free survival"
)| IPCW Cox regression results for the association between treatment group and progression-free survival | |||
| Scale | Estimate | Lower 95% PI1 | Upper 95% PI1 |
|---|---|---|---|
| log(HR) | -1.41 | -1.55 | -0.95 |
| HR | 0.24 | 0.21 | 0.39 |
| 1 PI = percentile interval | |||