Plot conditional survival curves
Emily C. Zabor
Last updated: 2022-10-20
plot_cs.Rmd
library(condsurv)
library(survival)
#> Warning: package 'survival' was built under R version 4.2.1
library(ggplot2)
library(dplyr)
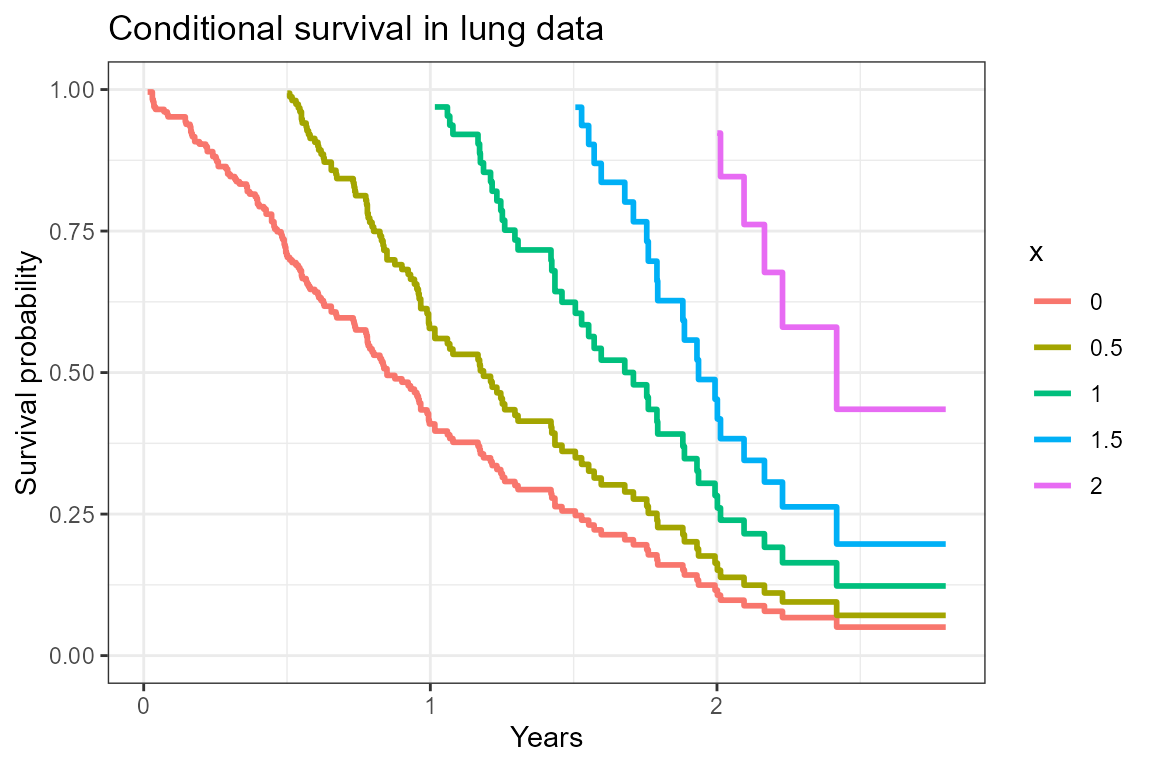
#> Warning: package 'dplyr' was built under R version 4.2.1To plot the conditional survival curves at baseline, and for those
who have survived 6 months, 1 year, 1.5 years, and 2 years, we use the
gg_conditional_surv function.
The lung dataset from the survival package
will be used to illustrate.
# Scale the time variable to be in years rather than days
lung2 <-
  mutate(
    lung,
    os_yrs = time / 365.25
  )
myfit <- survfit(Surv(os_yrs, status) ~ 1, data = lung2)

cond_times <- seq(0, 2, 0.5)

gg_conditional_surv(
  basekm = myfit,
  at = cond_times,
  main = "Conditional survival in lung data"
  )