Access the colors in a CCF branded color palette
ccf_palette.RdCCF brand colors can be accessed and used in plotting
ccf_palette(name = "main", n, type = c("discrete", "continuous"))Arguments
- name
Name of desired palette, supplied in quotes. Choices are: "main" (default), "bright", "neutral", "all", "blues", and "greens"
- n
Number of colors desired. If omitted, uses all colors, or the needed number of colors if less than the total.
- type
Either "continuous" or "discrete". Use continuous if you want to automatically interpolate between colours. @importFrom graphics rgb rect par image text @importFrom grDevices colorRampPalette
Value
A vector of colours.
Examples
library(ggplot2)
# Print a plot to visualize the colors in a palette, in order
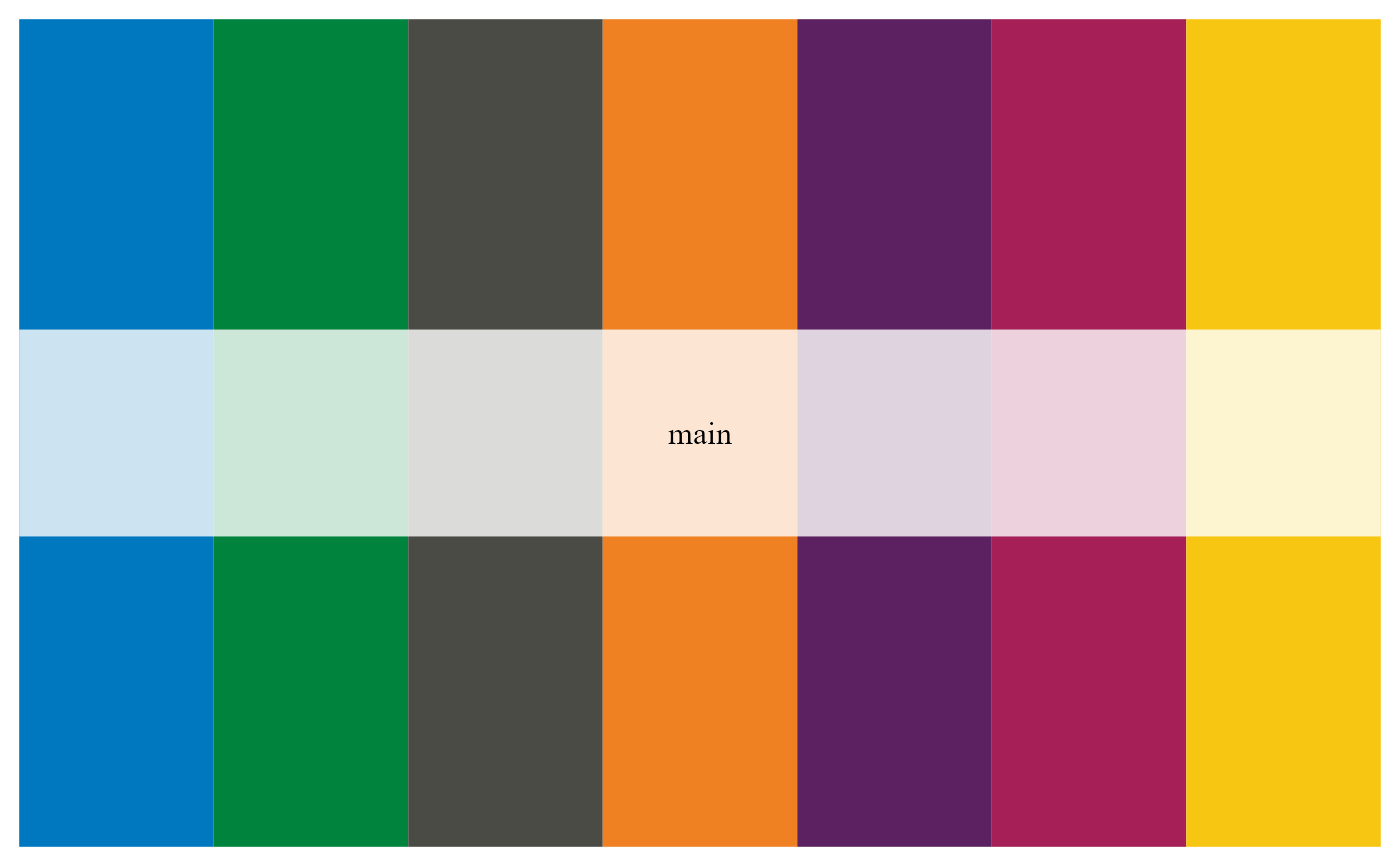
ccf_palette("main")
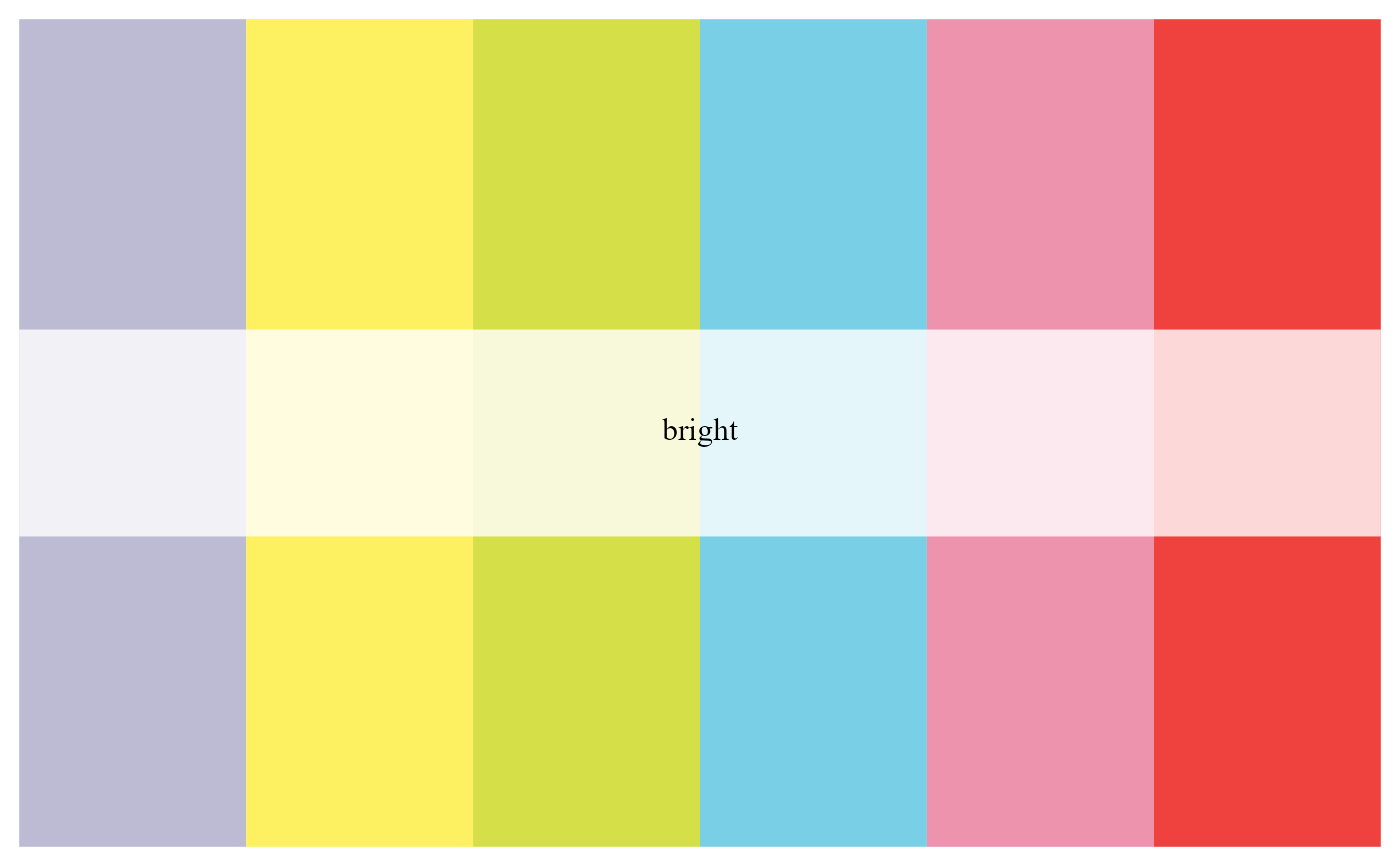
 ccf_palette("bright")
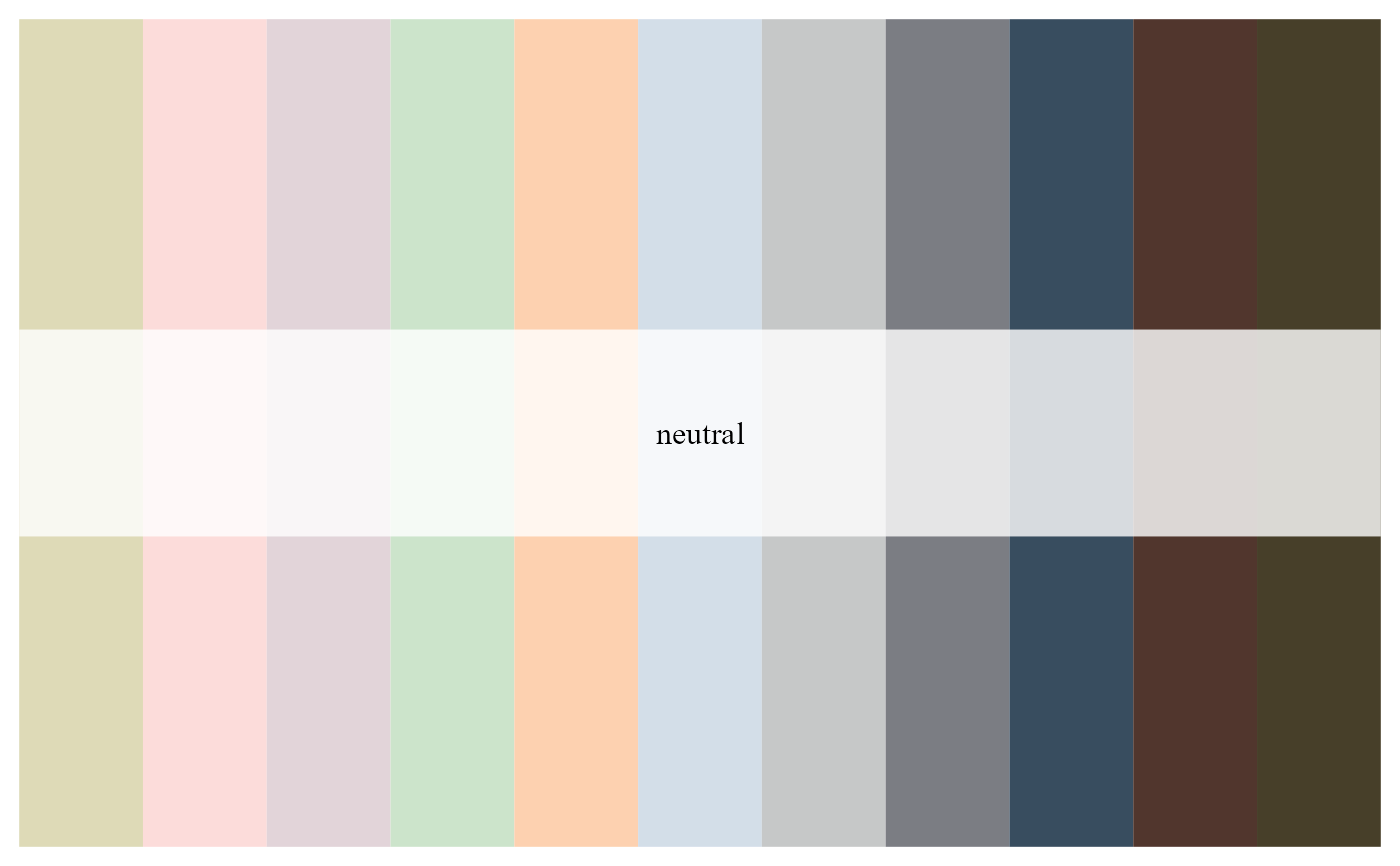
 ccf_palette("neutral")
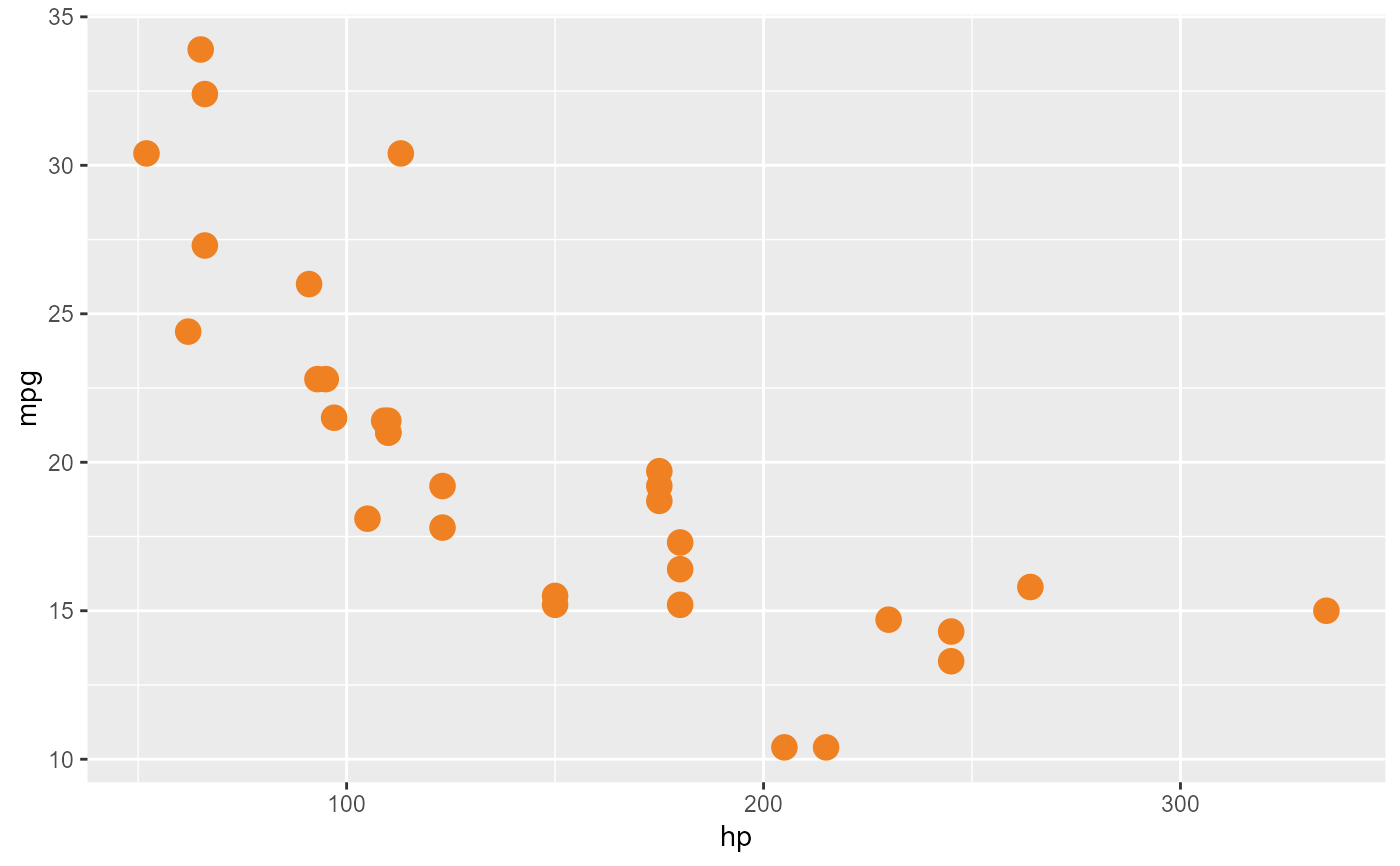
 # use a single brand color from a palette
# here using the fourth color from the "main" palette
ggplot(mtcars, aes(hp, mpg)) +
geom_point(size = 4, color = ccf_palette("main")[4])
# use a single brand color from a palette
# here using the fourth color from the "main" palette
ggplot(mtcars, aes(hp, mpg)) +
geom_point(size = 4, color = ccf_palette("main")[4])
 # as an alternative to the above, you can select a single color by name
ggplot(mtcars, aes(hp, mpg)) +
geom_point(size = 4, color = ccf_cols("tango"))
# as an alternative to the above, you can select a single color by name
ggplot(mtcars, aes(hp, mpg)) +
geom_point(size = 4, color = ccf_cols("tango"))
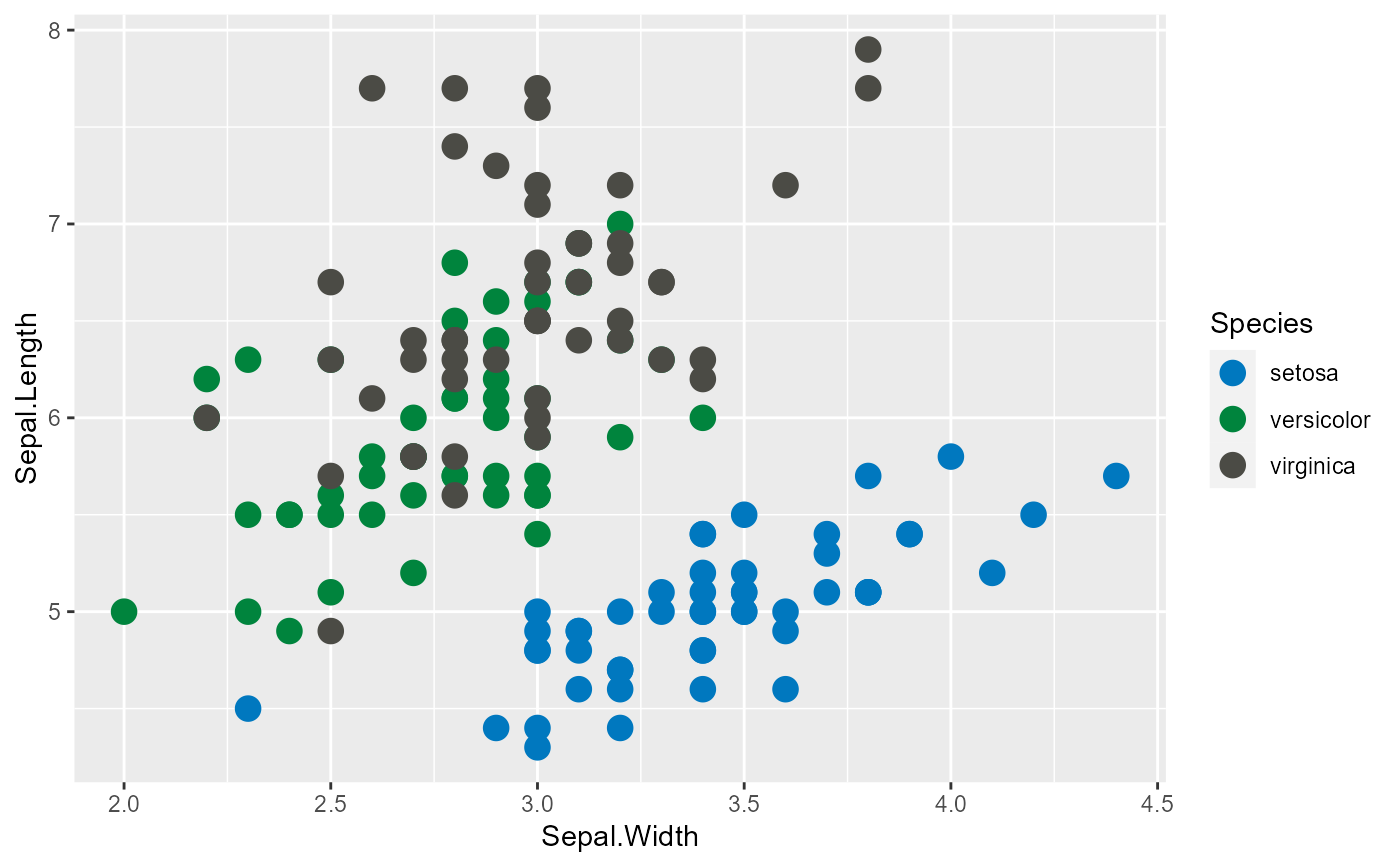
 # use a discrete color scale - uses fixed colors from the requested palette
ggplot(iris, aes(Sepal.Width, Sepal.Length, color = Species)) +
geom_point(size = 4) +
scale_color_manual(values = ccf_palette("main"))
# use a discrete color scale - uses fixed colors from the requested palette
ggplot(iris, aes(Sepal.Width, Sepal.Length, color = Species)) +
geom_point(size = 4) +
scale_color_manual(values = ccf_palette("main"))
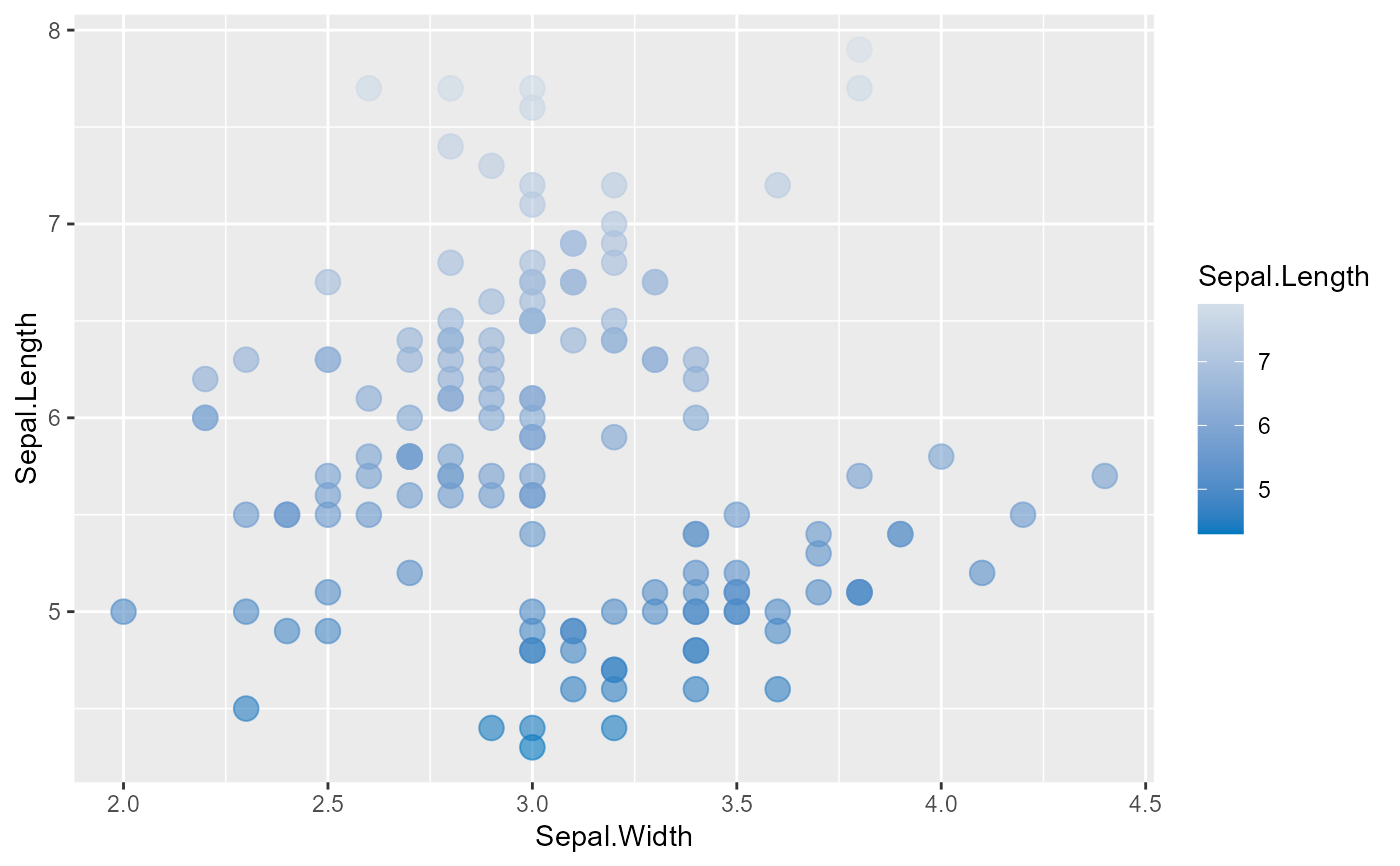
 # use a continuous color scale - interpolates between colors
ggplot(iris, aes(Sepal.Width, Sepal.Length, color = Sepal.Length)) +
geom_point(size = 4, alpha = .6) +
scale_color_gradientn(colors = ccf_palette("blues", type = "continuous"))
# use a continuous color scale - interpolates between colors
ggplot(iris, aes(Sepal.Width, Sepal.Length, color = Sepal.Length)) +
geom_point(size = 4, alpha = .6) +
scale_color_gradientn(colors = ccf_palette("blues", type = "continuous"))
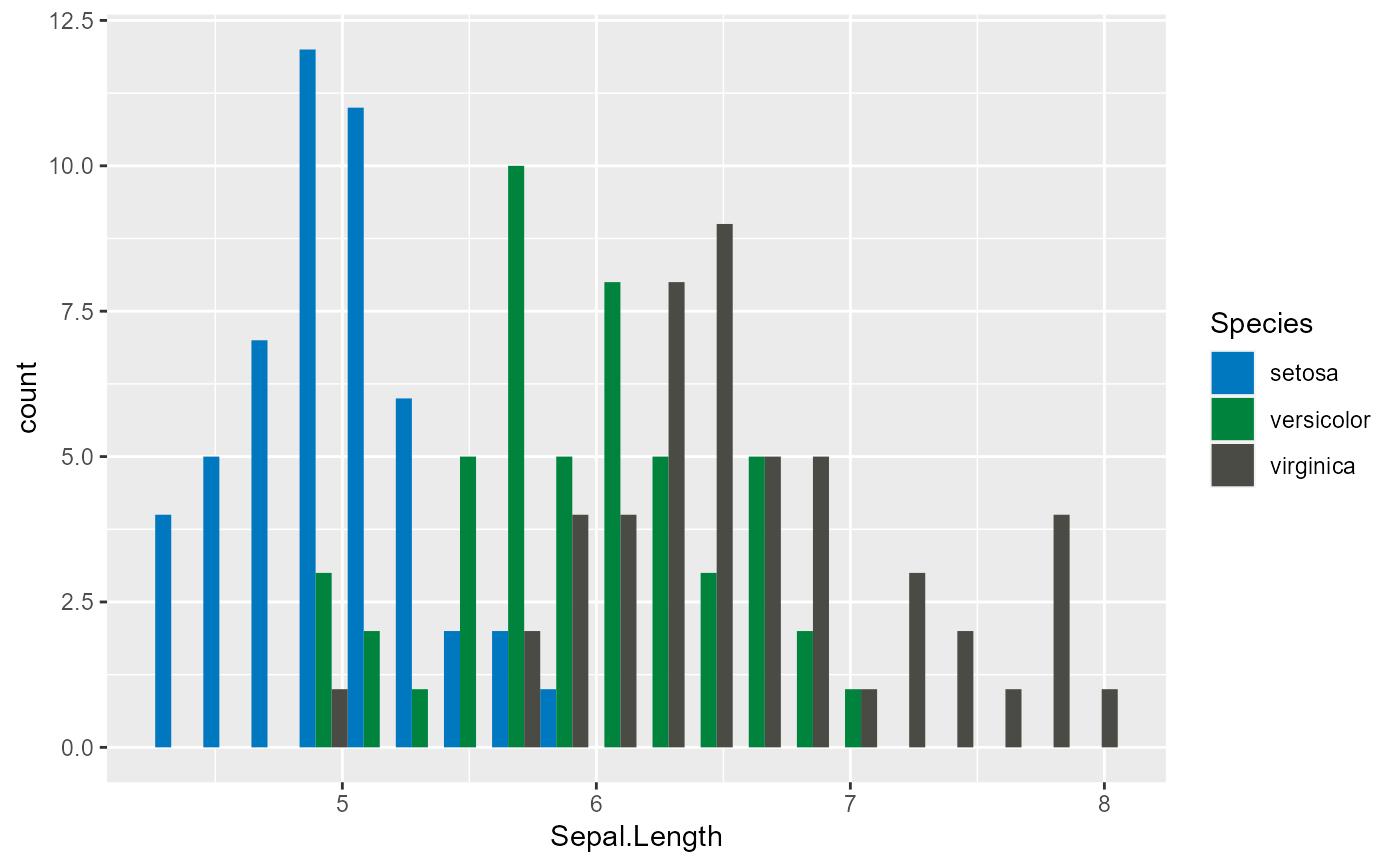
 # use a fill color
ggplot(iris, aes(x = Sepal.Length, fill = Species)) +
geom_histogram(bins = 20, position = "dodge") +
scale_fill_manual(values = ccf_palette("main"))
# use a fill color
ggplot(iris, aes(x = Sepal.Length, fill = Species)) +
geom_histogram(bins = 20, position = "dodge") +
scale_fill_manual(values = ccf_palette("main"))